🔎 Missing Values Treatment#
👨🏫 Vikesh K
📓 Lab 05
💡 “It does not matter how slowly you go as long as you do not stop” - Confucius 💡
📝Lab Agenda#
Missing Values
Finding
Imputing missing values
Note
Missing values is an important area of consideration when doing data analysis. First of all, the presence of missing value means that you maybe lacking important information which is crucial to take the right decisions based on the data. It could also mean something amiss in the data-collection method. We can’t also build a machine learning model with missing values in the data. Hence, we need to rectify it. Missing value treatment like outlier treatment needs domain understanding. How should we impute a missing value, should we drop it? All of these questions necessitate that you understand the business context and the implication of these actions.
In the notebook we will focus on different operations to deal with missing values.
Importing Modules and data#
import pandas as pd

import matplotlib.pyplot as plt
import seaborn as sns

import warnings
warnings.filterwarnings("ignore")
url = 'https://raw.githubusercontent.com/vkoul/data/main/misc/titanic.csv'

df = pd.read_csv(url)

df.head()
| PassengerId | Survived | Pclass | Name | Sex | Age | SibSp | Parch | Ticket | Fare | Cabin | Embarked | |
|---|---|---|---|---|---|---|---|---|---|---|---|---|
| 0 | 1 | 0 | 3 | Braund, Mr. Owen Harris | male | 22.0 | 1 | 0 | A/5 21171 | 7.2500 | NaN | S |
| 1 | 2 | 1 | 1 | Cumings, Mrs. John Bradley (Florence Briggs Th... | female | 38.0 | 1 | 0 | PC 17599 | 71.2833 | C85 | C |
| 2 | 3 | 1 | 3 | Heikkinen, Miss. Laina | female | 26.0 | 0 | 0 | STON/O2. 3101282 | 7.9250 | NaN | S |
| 3 | 4 | 1 | 1 | Futrelle, Mrs. Jacques Heath (Lily May Peel) | female | 35.0 | 1 | 0 | 113803 | 53.1000 | C123 | S |
| 4 | 5 | 0 | 3 | Allen, Mr. William Henry | male | 35.0 | 0 | 0 | 373450 | 8.0500 | NaN | S |
Missing value count#
The .isna() function allows us to check whether the entries in the pandas dataframe are na or not. In pandas, there is an equivalent function too named - .isnull(). You can use either, however since the most of the imputation function of pandas use na, we will mainly use isna() to maintain continuity.
df.isna()
| PassengerId | Survived | Pclass | Name | Sex | Age | SibSp | Parch | Ticket | Fare | Cabin | Embarked | |
|---|---|---|---|---|---|---|---|---|---|---|---|---|
| 0 | False | False | False | False | False | False | False | False | False | False | True | False |
| 1 | False | False | False | False | False | False | False | False | False | False | False | False |
| 2 | False | False | False | False | False | False | False | False | False | False | True | False |
| 3 | False | False | False | False | False | False | False | False | False | False | False | False |
| 4 | False | False | False | False | False | False | False | False | False | False | True | False |
| ... | ... | ... | ... | ... | ... | ... | ... | ... | ... | ... | ... | ... |
| 886 | False | False | False | False | False | False | False | False | False | False | True | False |
| 887 | False | False | False | False | False | False | False | False | False | False | False | False |
| 888 | False | False | False | False | False | True | False | False | False | False | True | False |
| 889 | False | False | False | False | False | False | False | False | False | False | False | False |
| 890 | False | False | False | False | False | False | False | False | False | False | True | False |
891 rows × 12 columns
The isna() function returns a boolean status for each of the values. False means that particular value is not a missing value and True means, there was a missing value. However this information is not actionable. We need to summarise this information, we can do that by chaining isna() command with the arthimetic commands - .sum() and .mean().
df.isna().sum(): Counts the sum of missing values in each column of the data framedf.isna().means(): Counts the share of missing values in each column of the data frame
Both of these functions are important, we need to know the count of missing values. However, data size context is important. Are there 100 missing values in data with 1000 rows or 1 million rows. Hence, knowing the percentage of missing values in column becomes important. It helps us understand how severe the data quality issue is and what should be done.
df.isna().sum()
PassengerId      0
Survived         0
Pclass           0
Name             0
Sex              0
Age            177
SibSp            0
Parch            0
Ticket           0
Fare             0
Cabin          687
Embarked         2
dtype: int64
If you want to see the output in a dataframe view, then we can use .to_frame()
Plus we would have to rename the column as well. Since we are going to use multiple commands, I will chain them and keep one command for each line to improve readability. For multiple line pandas command, we need to keep them in ()
(df
 .isna() # check for missing values
 .sum() # convert the boolean to numeric and summarise
 .to_frame() # convert to a data-frame
 .rename(columns = {0: "missing_values"}) # rename the column name
)
| missing_values | |
|---|---|
| PassengerId | 0 |
| Survived | 0 |
| Pclass | 0 |
| Name | 0 |
| Sex | 0 |
| Age | 177 |
| SibSp | 0 |
| Parch | 0 |
| Ticket | 0 |
| Fare | 0 |
| Cabin | 687 |
| Embarked | 2 |
Visualize the missing values#
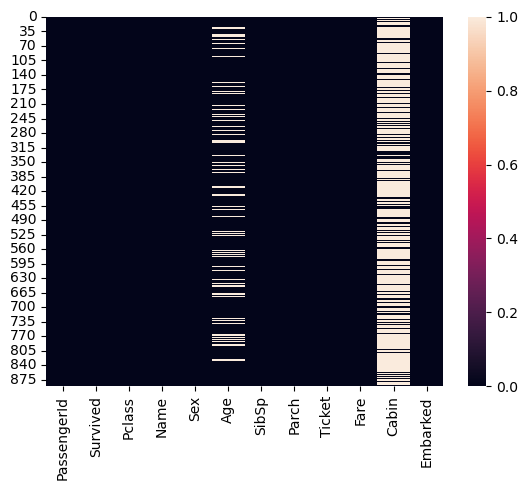
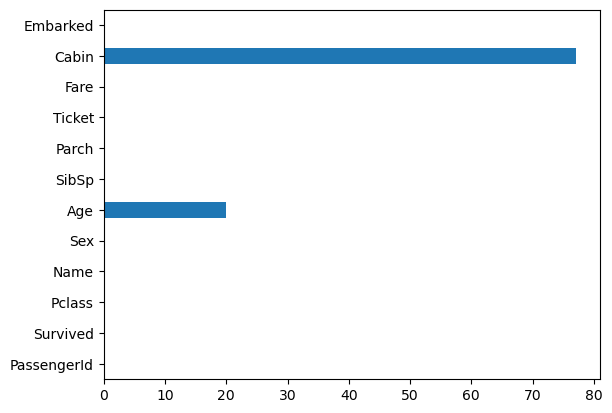
Using seaborn and inbuilt pandas plotting, you can also visualize the missing value to get an understand on how these missing values are spread across your data
Heatmaps
sns.heatmap(df.isna());

Bar plots
df.isna().mean().multiply(100).round(1).plot(kind = 'barh');

Imputation#
Imputation means we will fill the missing values. The treatment can be simple, using mean or median values or you can also take the help of a machine learning methods to do this. It will also vary for categorical and numerical values
Pandas functions for missing value treatment are:
df.fillna()- Most commonly used method.
Simple Imputations#
Numerical column imputation#
df1 = df.copy()
df1.isna().sum()
PassengerId      0
Survived         0
Pclass           0
Name             0
Sex              0
Age            177
SibSp            0
Parch            0
Ticket           0
Fare             0
Cabin          687
Embarked         2
dtype: int64
Understanding the summary value of the age column
mean_age = df['Age'].mean().round(1)

#median
median_age = df['Age'].median()

print(f"The mean age of the titanic passengers is {mean_age}")
print(f"The median age of the titanic passengers is {median_age}")
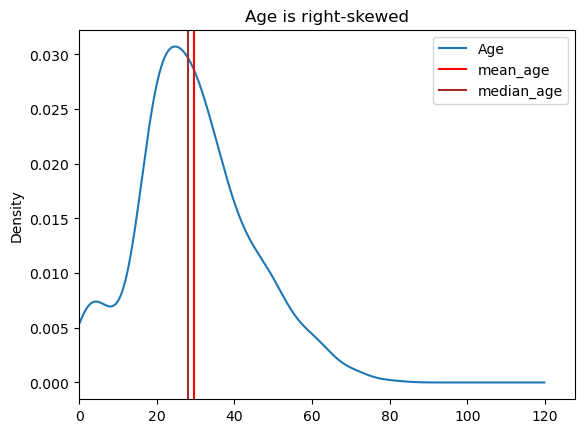
The mean age of the titanic passengers is 29.7
The median age of the titanic passengers is 28.0
There is ~2 years of difference between mean and median age, which one should we choose? It often depends on data skew. If the data is skewed, its better to use median rather than mean.
df['Age'].plot(kind = 'kde', xlim = 0, title = "Age is right-skewed");

plt.axvline(df['Age'].mean(), color = 'red', label = "mean_age")
plt.axvline(df['Age'].median(), color = 'brown', label = "median_age")

plt.legend();

I will create a copy of the original dataframe before doing the imputation, so that we can showcase other imputation methods
df1 = df.copy() # create a copy of the df
df1.isna().sum()
PassengerId      0
Survived         0
Pclass           0
Name             0
Sex              0
Age            177
SibSp            0
Parch            0
Ticket           0
Fare             0
Cabin          687
Embarked         2
dtype: int64
Fill the missing enteries with the median_age
df1['Age'].fillna(value = median_age, inplace = True)
# recheck the missing values
df1.isna().sum()
PassengerId      0
Survived         0
Pclass           0
Name             0
Sex              0
Age              0
SibSp            0
Parch            0
Ticket           0
Fare             0
Cabin          687
Embarked         2
dtype: int64
Categorical Column Imputations#
We have Embarked column which is a categorical column and we can’t use the mean() or median() methods to impute a categorical columns. However, we can replace a missing value in categorical with the most frequently occuring value, especially when there are only two missing values
The most frequently occuring value can be calculated using the .mode() function
df['Embarked'].value_counts()
Embarked
S    644
C    168
Q     77
Name: count, dtype: int64
S is the most frequented value in the table. We can calculate this using mode() function
mode_embarked = df['Embarked'].mode()[0] # we have to use [0] otherwise we get a series
mode_embarked
'S'
df1['Embarked'].fillna(value = mode_embarked, inplace = True)
# recheck the missing values
df1.isna().sum()
PassengerId      0
Survived         0
Pclass           0
Name             0
Sex              0
Age              0
SibSp            0
Parch            0
Ticket           0
Fare             0
Cabin          687
Embarked         0
dtype: int64
Note
Cabin column is a tricky one. First of all it has 77% missing values and also, there is no clear way we can fill in this missing value. It is just a label of the cabins. Secondly, it won’t be useful for any data analysis that we plan for Titanic data, hence we can drop the whole column.
df1 = df1.drop(columns = "Cabin", axis = 1)
df1.isna().sum()
PassengerId    0
Survived       0
Pclass         0
Name           0
Sex            0
Age            0
SibSp          0
Parch          0
Ticket         0
Fare           0
Embarked       0
dtype: int64
Hence with the simple imputation methods we are able to impute all the missing values
ML based Imputation#
Please focus on this section when you cover the ML topics
df2 = df.copy() # creating a copy from the original dataset
df2_numeric = df2.select_dtypes(['float', 'int']).drop(columns = "PassengerId", axis = 1)
df2_numeric.isna().sum()
Survived      0
Pclass        0
Age         177
SibSp         0
Parch         0
Fare          0
dtype: int64
Initiating the imputer
from sklearn.impute import KNNImputer

imputer = KNNImputer(n_neighbors=2)
# imputed values output
imputed_matrix = imputer.fit_transform(df2_numeric)
Convert the output into a pandas dataframe
df2_numeric_imputed = pd.DataFrame(imputed_matrix, columns = df2_numeric.columns)
df2_numeric_imputed.isna().sum()
Survived    0
Pclass      0
Age         0
SibSp       0
Parch       0
Fare        0
dtype: int64
df2_numeric_imputed['Age'].mean()
30.149741863075196
